2 Introduction
Highly multiplexed imaging (HMI) enables the simultaneous detection of dozens of biological molecules (e.g., proteins, transcripts; also referred to as “markers”) in tissues. Recently established multiplexed tissue imaging technologies rely on cyclic staining with fluorescently-tagged antibodies (Lin et al. 2018; Gut et al. 2018), or the use of oligonucleotide-tagged (Goltsev et al. 2018; Saka et al. 2019) or metal-tagged (Giesen et al. 2014; Angelo et al. 2014) antibodies, among others. The key strength of these technologies is that they allow in-depth analysis of single cells within their spatial tissue context. As a result, these methods have enabled analysis of the spatial architecture of the tumor microenvironment (Lin et al. 2018; Jackson et al. 2020; Ali et al. 2020; Schürch et al. 2020), determination of nucleic acid and protein abundances for assessment of spatial co-localization of cell types and chemokines (Hoch et al. 2022) and spatial niches of virus infected cells (Jiang et al. 2022), and characterization of pathological features during COVID-19 infection (Rendeiro et al. 2021; Mitamura et al. 2021), Type 1 diabetes progression (Damond et al. 2019) and autoimmune disease (Ferrian et al. 2021).
Imaging mass cytometry (IMC) utilizes metal-tagged antibodies to detect over 40 proteins and other metal-tagged molecules in biological samples. IMC can be used to perform highly multiplexed imaging and is particularly suited to profiling selected areas of tissues across many samples.
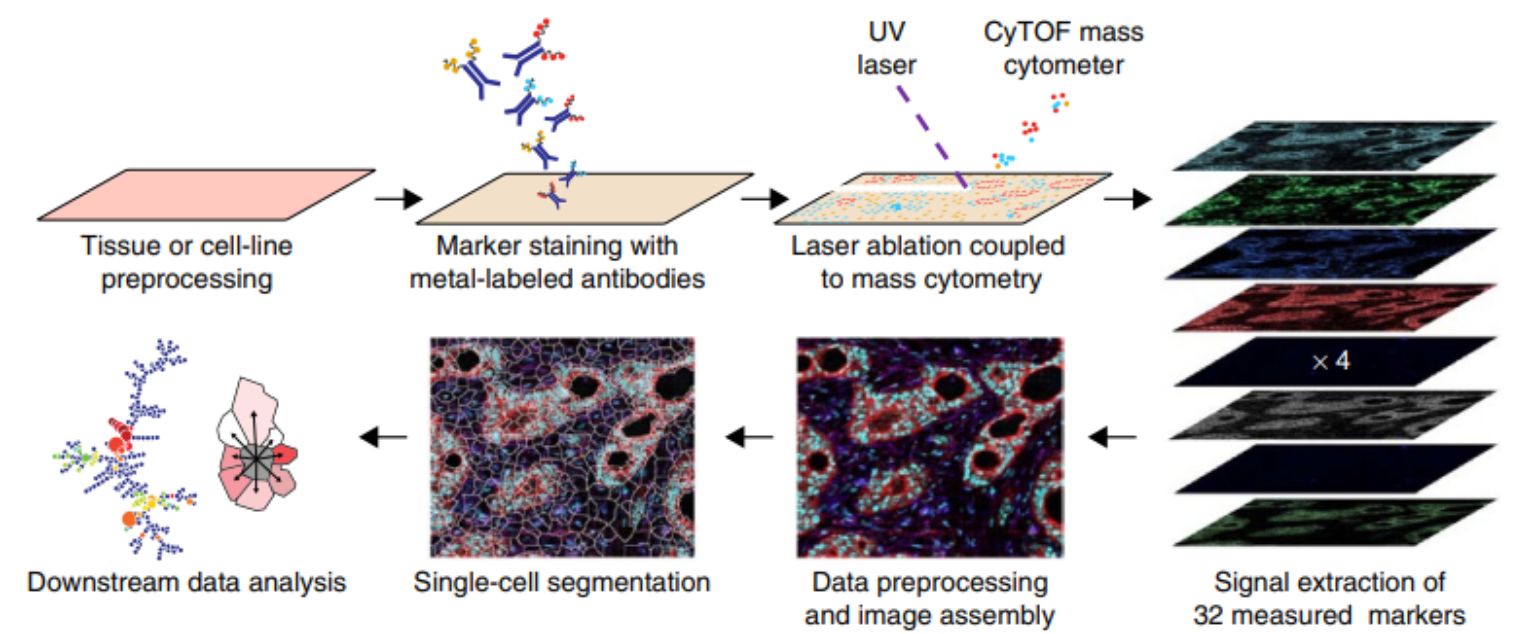 Overview of imaging mass cytometry data acquisition. Taken from (Giesen et al. 2014)
IMC has first been published in 2014 (Giesen et al. 2014) and has been commercialized by Standard BioToolsTM to be distributed as the Hyperion Imaging SystemTM (documentation is available here). Similar to other HMI technologies such as MIBI (Angelo et al. 2014), CyCIF (Lin et al. 2018), 4i (Gut et al. 2018), CODEX (Goltsev et al. 2018) and SABER (Saka et al. 2019), IMC captures the spatial expression of multiple proteins in parallel. With a nominal 1 μm resolution, IMC is able to detect cytoplasmic and nuclear localization of proteins. The current ablation frequency of IMC is 200Hz, meaning that a 1 mm\(^2\) area can be imaged within about 2 hours.
2.1 Technical details of IMC
Technical aspects of how data acquisition works can be found in the original publication (Giesen et al. 2014). Briefly, antibodies to detect targets in biological material are labeled with heavy metals (e.g., lanthanides) that do not occur in biological systems and thus can be used upon binding to their target as a readout similar to fluorophores in fluorescence microscopy. Thin sections of the biological sample on a glass slide are stained with an antibody cocktail. Stained microscopy slides are mounted on a precise motor-driven stage inside the ablation chamber of the IMC instrument. A high-energy UV laser is focused on the tissue, and each individual laser shot ablates tissue from an area of roughly 1 μm\(^2\). The energy of the laser is absorbed by the tissue resulting in vaporization followed by condensation of the ablated material. The ablated material from each laser shot is transported in the gas phase into the plasma of the mass cytometer, where first atomization of the particles and then ionization of the atoms occurs. The ion cloud is then transferred into a vacuum, and all ions below a mass of 80 m/z are filtered using a quadrupole mass filter. The remaining ions (mostly those used to tag antibodies) are analyzed in a time-of-flight mass spectrometer to ultimately obtain an accumulated mass spectrum from all ions that correspond to a single laser shot. One can regard this spectrum as the information underlying a 1 μm\(^2\) pixel. With repetitive laser shots (e.g., at 200 Hz) and a simultaneous lateral sample movement, a tissue can be ablated pixel by pixel. Ultimately an image is reconstructed from each pixel mass spectrum.
In principle, IMC can be applied to the same type of samples as conventional fluorescence microscopy. The largest distinction from fluorescence microscopy is that for IMC, primary-labeled antibodies are commonly used, whereas in fluorescence microscopy secondary antibodies carrying fluorophores are widely applied. Additionally, for IMC, samples are dried before acquisition and can be stored for years. Formalin-fixed and paraffin-embedded (FFPE) samples are widely used for IMC. The FFPE blocks are cut to 2-5 μm thick sections and are stained, dried, and analyzed with IMC.
2.1.1 Metal-conjugated antobodies and staining
Metal-labeled antibodies are used to stain molecules in tissues enabling to delineate tissue structures, cells, and subcellular structures. Metal-conjugated antibodies can either be purchased directly from Standard BioToolsTM (MaxPar IMC Antibodies), or antibodies can be purchased and labeled individually (MaxPar Antibody Labeling). Antibody labeling using the MaxPar kits is performed via TCEP antibody reduction followed by crosslinking with sulfhydryl-reactive maleimide-bearing metal polymers. For each antibody it is essential to validate its functionality, specificity and optimize its usage to provide optimal signal to noise. To facilitate antibody handling, a database is highly useful. Airlab is such a platform; it allows antibody lot tracking, validation data uploads, and panel generation for subsequent upload to the IMC acquisition software from Standard BioToolsTM
Depending on the sample type, different staining protocols can be used. Generally, once antibodies of choice have been conjugated to a metal tag, titration experiments are performed to identify the optimal staining concentration. For FFPE samples, different staining protocols have been described, and different antibodies show variable staining with different protocols. Protocols such as the one provided by Standard BioToolsTM or the one describe by (Ijsselsteijn et al. 2019) are recommended. Briefly, for FFPE tissues, a dewaxing step is performed to remove the paraffin used to embed the material, followed by a graded re-hydration of the samples. Thereafter, heat-induced epitope retrieval (HIER), a step aiming at the reversal of formalin-based fixation, is used to unmask epitopes within tissues and make them accessible to antibodies. Epitope unmasking is generally performed in either basic, EDTA-based buffers (pH 9.2) or acidic, citrate-based buffers (pH 6). Next, a buffer containing bovine serum albumin (BSA) is used to block non-specific binding. This buffer is also used to dilute antibody stocks for the actual antibody staining. Staining time and temperature may vary and optimization must be performed to ensure that each single antibody performs well. However, overnight staining at 4°C or 3-5 hours at room temperature seem to be suitable in many cases.
Following antibody incubation, unbound antibodies are washed away and a counterstain comparable to DAPI is applied to enable the identification of nuclei. The Iridium intercalator from Standard BioToolsTM is a reagent of choice and applied in a brief 5 minute staining. Finally, the samples are washed again and then dried under an airflow. Once dried, the samples are ready for analysis using IMC and are usually stable for a long period of time (at least one year).
2.1.2 Data acquisition
Data is acquired using the CyTOF software from Standard BioToolsTM (see manuals here).
The regions of interest are selected by providing coordinates for ablation. To determine the region to be imaged, so called “panoramas” can be generated. These are stitched images of single fields of views of about 200 μm in diameter. Panoramas provide an optical overview of the tissue with a resolution similar to 10x in microscopy and are intended to help with the selection of regions of interest for ablation. The tissue should be centered on the glass side, since the imaging mass cytometer cannot access roughly 5 mm from each of the slide edges. Currently, the instruments can process one slide at a time and usually one MCD file per sample slide is generated.
Many regions of interest can be defined on a single slide and acquisition parameters such as channels to acquire, acquisition speed (100 Hz or 200 Hz), ablation energy, and other parameters are user-defined. It is recommended that all isotope channels are recorded. This will result in larger raw data files but valuable information such as potential contamination of the argon gas (e.g., Xenon) or of the samples (e.g., lead, barium) is stored.
To process a large number of slides or to select regions on whole-slide samples, panoramas may not provide sufficient information. If this is the case, multi-color immunofluorescence of the same slide prior to staining with metal-labeled antibodies may be performed. To allow for region selection based on immunofluorescence images and to align those images with a panorama of the same or consecutive sections of the sample, we developed napping.
Acquisition time is directly proportional to the total size of ablation, and run times for samples of large area or for large sample numbers can roughly be calculated by dividing the ablation area in square micrometer by the ablation speed (e.g., 200Hz). In addition to the proprietary MCD file format, TXT files can also be generated for each region of interest. This is recommended as a back-up option in case of errors that may corrupt MCD files but not TXT files.
2.2 IMC data format
Upon completion of the acquisition an MCD file of variable size is generated. A single MCD file can hold raw acquisition data for multiple regions of interest, optical images providing a slide level overview of the sample (“panoramas”), and detailed metadata about the experiment. Additionally, for each acquisition a TXT file is generated which holds the same pixel information as the matched acquisition in the MCD file.
The Hyperion Imaging SystemTM produces files in the following folder structure:
.
+-- {XYZ}_ROI_001_1.txt
+-- {XYZ}_ROI_002_2.txt
+-- {XYZ}_ROI_003_3.txt
+-- {XYZ}.mcd
Here, {XYZ} defines the filename, ROI_001, ROI_002, ROI_003 are
user-defined names (descriptions) for the selected regions of interest (ROI),
and 1, 2, 3 indicate the unique acquisition identifiers. The ROI
description entry can be specified in the Standard BioTools software when
selecting ROIs. The MCD file contains the raw imaging data and the full metadata
of all acquired ROIs, while each TXT file contains data of a single ROI without
metadata. To follow a consistent naming scheme and to bundle all metadata, we
recommend to zip the folder. Each ZIP file should only contain data from a
single MCD file, and the name of the ZIP file should match the name of the MCD
file.
We refer to this data as raw data and the further processing of this data is described in Section 3.
2.3 IMC instruments and acquisition types
2.3.1 Instrumentation
In 2023 Standard BioToolsTM release the latest
version of IMC machines - the XTi. Compared to the previous generation -
Hyperion - this new generation obtained an extensive makeover. The
principle of IMC remains the same for this latest generation of machines but under the hood many
technical parts have been changed. While this enabled some noteworthy updates,
XTis do not produce TXT files any more. TXT files have previously been used as
recovery files for corrupt mcd files during processing with steinbock, and
importantly for spillover correction. To account for this, section
@ref(spillover_XTi) now contains a paragraph on spillover correction
with data from XTis. The biggest improvement of XTis is measurement speed and throughput.
XTis measure at 800 Hz and 1 mm\(^2\) is ablated in approximately 25 min. The XTi
has comparable or slightly higher sensitivity compared to a machine of the
previous generation. Of note, laser energy optimization is more important on the
XTis because ablation with too much laser energy can lead to excessive presence
of hot pixels.
Additionally, the process of panorama generation is much faster and whole-slide
panoramas are now recorded in 15-20 minutes. To allow for higher throughput, a
slideloader is commercially available from Standard BioToolsTM enabling batch processing of up to 40 slides. These two
updates now enable throughput of dozens of slides per day thereby allowing
researchers to tackle projects for which no tissue microarrays are available or
feasible.
2.3.2 Acquisition types
Besides speed and throughput, XTis also have two additional measurement modes: 1) Pixel-skipping and 2) tissue-mode. Pixel-skipping performs, as the name implies, lateral and vertical pixel-skipping and in standard settings measures 1 out of 25 pixels in X and Y directions. This enables the generation of whole-slide images in about 20-30 minutes at low resolution for the purpose of region of interest selection or pixel clustering or other, relatively unexplored research questions. In tissue-mode, laser focus and energy are changed and approximately 5 µm\(^2\) spots are ablated. In this mode whole-slide images are generated in approximately 1-2 hours and they provide better detail than pixel-skipped data. As of January 2026, no publications are available that made use of either of these two approaches and it remains to be seen how useful these measurement modes are.
2.3.3 High-resolution IMC (HR-IMC)
To improve the limited resolution of 1 µm in IMC a study used oversampling
coupled with deconvolution to achieve a resolution of up to 333 nm
(Bollhagen et al. 2025). This approach can reveal subcellular structures and is
particularly suited to address questions that require resolution beyond the
single-cell level. On the downside, HR-IMC comes with a significant decrease in
acquisition speed (~10-fold) and due to oversampling and less material being
ablated there is also a decrease in sensitivity compared with 1 µm resolution.
Compared with classic IMC only few adaptations need to be made. Firstly, the
user needs to identify the optimal laser energy to allow oversampling and
determine the inflection point at which 50% of the original signal are detected
which is needed for downstream deconvolution. Once the optimal laser energy has
been determined, the user needs to change the step size from 1 µm to the desired
step size (e.g. 0.333 µm) for the acquisition of the desired ROIs.
Once the data is acquired, preprocessing is performed using steinbock as for
regular IMC data, which is described below 3. The preprocessed
images are then deconvolved using a custom python script and thereafter are
ready to bes used as described throughout this book. Importantly, the
–pixelsize parameter must be adjusted accordingly for segmentation. For
detailed descriptions and instructions, please see
here.