Function to plot directed interaction graphs based on symbolic edge-lists and vertex metadata. The user can specify node, node_label and edge aesthetics using dedicated arguments. The resulting plot can be further refined with `ggplot2` for node styling and `ggraph` for edge-specific customization.
plotInteractions(
  out,
  object,
  label,
  group_by,
  node_color_by = NULL,
  node_size_by = NULL,
  node_color_fix = NULL,
  node_size_fix = NULL,
  node_label_repel = TRUE,
  node_label_color_by = NULL,
  node_label_color_fix = NULL,
  edge_color_by = NULL,
  edge_color_fix = NULL,
  edge_width_by = NULL,
  edge_width_fix = NULL,
  draw_edges = TRUE,
  return_data = FALSE,
  graph_layout = "circle"
)
Arguments
- out
a data frame, usually the output from
countInteractionsortestInteractions, representing an edge list with columns"group_by", "from_label" and "to_label". Additional columns may be included to specify edge attributes (weight or color).- object
a
SingleCellExperimentorSpatialExperimentobject.- label
single character specifying the
colData(object)entry which stores the cell labels. These can be cell-types labels or other metadata entries.- group_by
a single character indicating the
colData(object)entry by which interactions are grouped. This is usually the image or patient ID. a single character indicating thecolData(object)- node_color_by
single character either
NULL, "name","n_cells", "n_group"by which the nodes should be colored.- node_size_by
single character either
NULL, "n_cells","n_group"by which the size of the nodes are defined.- node_color_fix
single character specifying the color of all nodes.
- node_size_fix
single numeric specifying the size of all nodes.
- node_label_repel
should nodes be labelled? Defaults to TRUE.
- node_label_color_by
single character either
NULL, "name","n_cells","n_group"by which the node labels should be colored.- node_label_color_fix
single character specifying the color of all node labels.
- edge_color_by
single character indicating the name of the column of
"out"used represent edge colors. This column is usually newly added by the user and must assign a unique value to each 'from_label'–'to_label' pair. Typically, these values could encode the direction of significantly interacting cell type pairs.- edge_color_fix
single character specifying the color of all edges.
- edge_width_by
single character indicating the name of the column of
"out"used to scale edge widths. The values in this column are averaged for each 'from_label'–'to_label' pair. Typically, this could be the 'ct' column from of"out"or a newly added column representing an interaction feature.- edge_width_fix
single numeric specifying the width of all edges.
- draw_edges
should edges be drawn between nodes? Defaults to TRUE.
- return_data
should the edge list and vertex metadata for graph construction be returned as a
listof twodata.frames?- graph_layout
single character of
"circle", "chord", "linear", "fr", "kk", "drl", "stress", "graphopt",
"lgl", "tree", "sugiyama", "star", "nicely", "manual", "grid", "mds", "sphere",
"randomly", "gem", "dh"
which defines the graph layout. Defaults to"circle". For more information, see ggraph.
Value
returns a ggplot object or a list of two
data.frames.
See also
countInteractions for counting (but not testing) cell-cell
interactions per grouping level.
testInteractions for testing cell-cell
interactions per grouping level.
Examples
set.seed(22)
library(cytomapper)
library(BiocParallel)
data(pancreasSCE)
## 1. countInteractions or testInteractions
sce <- buildSpatialGraph(pancreasSCE, img_id = "ImageNb", type = "knn", k = 3)
#> The returned object is ordered by the 'ImageNb' entry.
count_out <- countInteractions(sce,
group_by = "ImageNb",
label = "CellType",
method = "classic", # choose from c("classic", "histocat", "patch", "interaction")
colPairName = "knn_interaction_graph")
test_out <- testInteractions(sce,
group_by = "ImageNb",
label = "CellType",
method = "classic", # choose from c("classic", "histocat", "patch", "interaction")
colPairName = "knn_interaction_graph",
iter = 100,
p_threshold = 0.5,
BPPARAM = SerialParam(RNGseed = 123))
## 2. Plot interactions
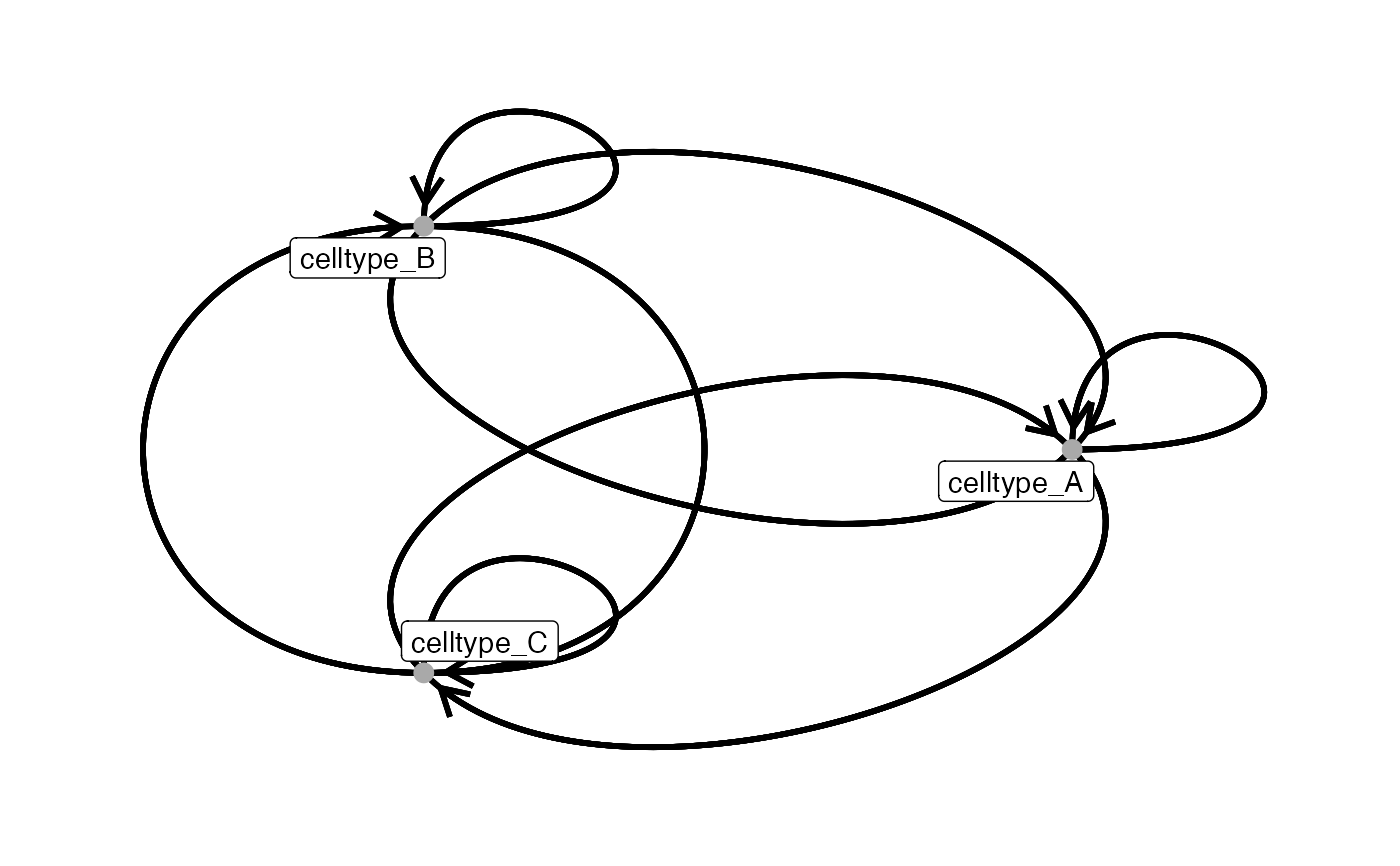
# default
plotInteractions(count_out, sce, "CellType", "ImageNb")
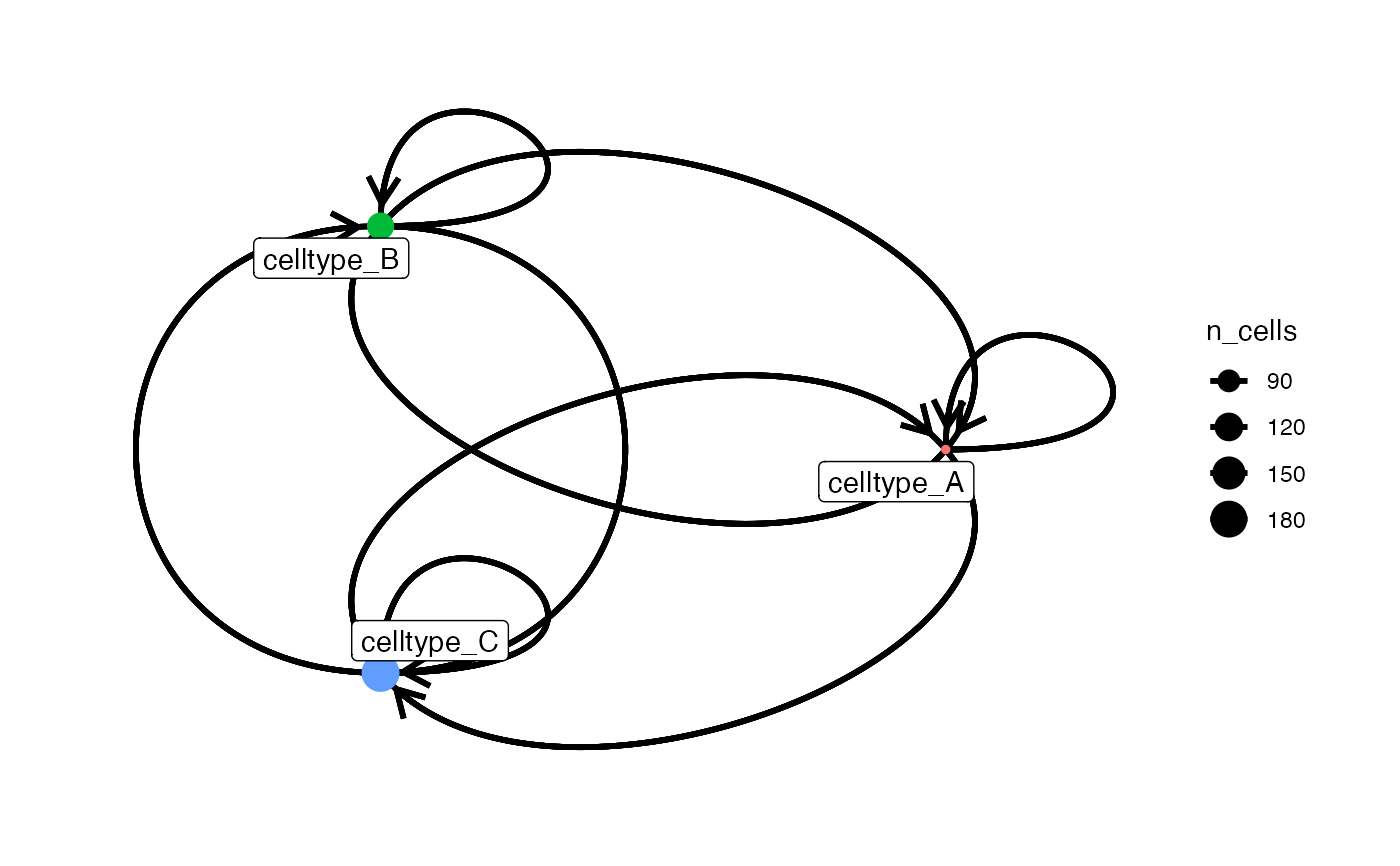
 # adjust node aesthetics
plotInteractions(count_out, sce, "CellType", "ImageNb",
node_color_by = "name",
node_size_by = "n_cells")
# adjust node aesthetics
plotInteractions(count_out, sce, "CellType", "ImageNb",
node_color_by = "name",
node_size_by = "n_cells")
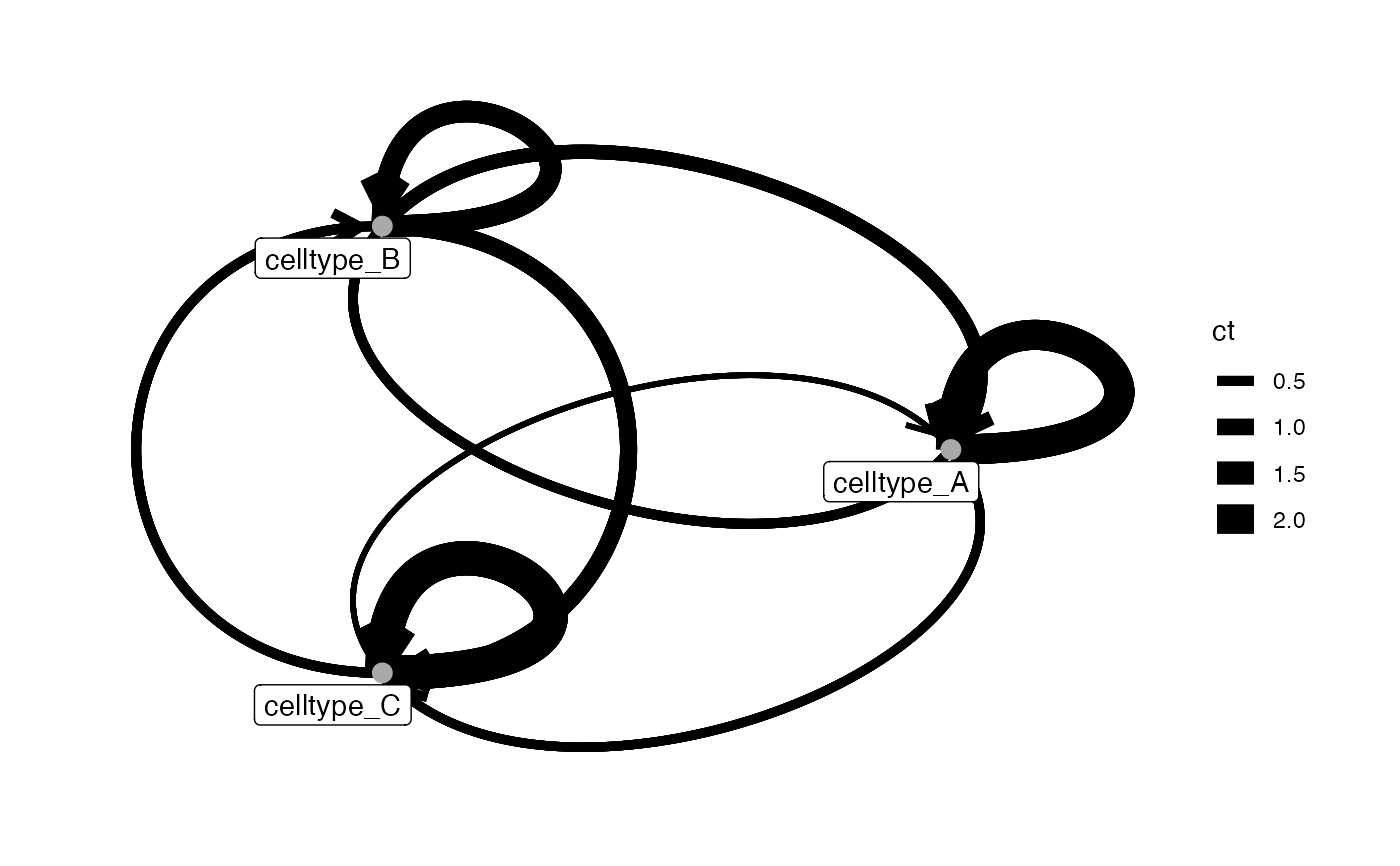
 # adjust edge aesthetics
plotInteractions(test_out, sce, "CellType", "ImageNb",
edge_width_by = "ct")
# adjust edge aesthetics
plotInteractions(test_out, sce, "CellType", "ImageNb",
edge_width_by = "ct")
 # Plot interactions - return data
plotInteractions(test_out, sce, "CellType", "ImageNb",
return_data = TRUE)
#> $edges
#> from_label to_label weight
#> 1 celltype_A celltype_A 1
#> 2 celltype_A celltype_B 1
#> 3 celltype_A celltype_C 1
#> 4 celltype_B celltype_A 1
#> 5 celltype_B celltype_B 1
#> 6 celltype_B celltype_C 1
#> 7 celltype_C celltype_A 1
#> 8 celltype_C celltype_B 1
#> 9 celltype_C celltype_C 1
#> 10 celltype_A celltype_A 1
#> 11 celltype_A celltype_B 1
#> 12 celltype_A celltype_C 1
#> 13 celltype_B celltype_A 1
#> 14 celltype_B celltype_B 1
#> 15 celltype_B celltype_C 1
#> 16 celltype_C celltype_A 1
#> 17 celltype_C celltype_B 1
#> 18 celltype_C celltype_C 1
#> 19 celltype_A celltype_A 1
#> 20 celltype_A celltype_B 1
#> 21 celltype_A celltype_C 1
#> 22 celltype_B celltype_A 1
#> 23 celltype_B celltype_B 1
#> 24 celltype_B celltype_C 1
#> 25 celltype_C celltype_A 1
#> 26 celltype_C celltype_B 1
#> 27 celltype_C celltype_C 1
#>
#> $vertices
#> CellType n_cells n_group
#> 1 celltype_A 62 2
#> 2 celltype_B 111 3
#> 3 celltype_C 189 3
#>
# Plot interactions - return data
plotInteractions(test_out, sce, "CellType", "ImageNb",
return_data = TRUE)
#> $edges
#> from_label to_label weight
#> 1 celltype_A celltype_A 1
#> 2 celltype_A celltype_B 1
#> 3 celltype_A celltype_C 1
#> 4 celltype_B celltype_A 1
#> 5 celltype_B celltype_B 1
#> 6 celltype_B celltype_C 1
#> 7 celltype_C celltype_A 1
#> 8 celltype_C celltype_B 1
#> 9 celltype_C celltype_C 1
#> 10 celltype_A celltype_A 1
#> 11 celltype_A celltype_B 1
#> 12 celltype_A celltype_C 1
#> 13 celltype_B celltype_A 1
#> 14 celltype_B celltype_B 1
#> 15 celltype_B celltype_C 1
#> 16 celltype_C celltype_A 1
#> 17 celltype_C celltype_B 1
#> 18 celltype_C celltype_C 1
#> 19 celltype_A celltype_A 1
#> 20 celltype_A celltype_B 1
#> 21 celltype_A celltype_C 1
#> 22 celltype_B celltype_A 1
#> 23 celltype_B celltype_B 1
#> 24 celltype_B celltype_C 1
#> 25 celltype_C celltype_A 1
#> 26 celltype_C celltype_B 1
#> 27 celltype_C celltype_C 1
#>
#> $vertices
#> CellType n_cells n_group
#> 1 celltype_A 62 2
#> 2 celltype_B 111 3
#> 3 celltype_C 189 3
#>