An introduction to imaging mass cytometry
IMC™ utilizes metal-tagged antibodies to detect over 40 proteins or other metal-tagged molecules in biological samples. IMC can be used to perform highly multiplexed imaging and is particularly suited to profiling selected areas of tissues across many samples.
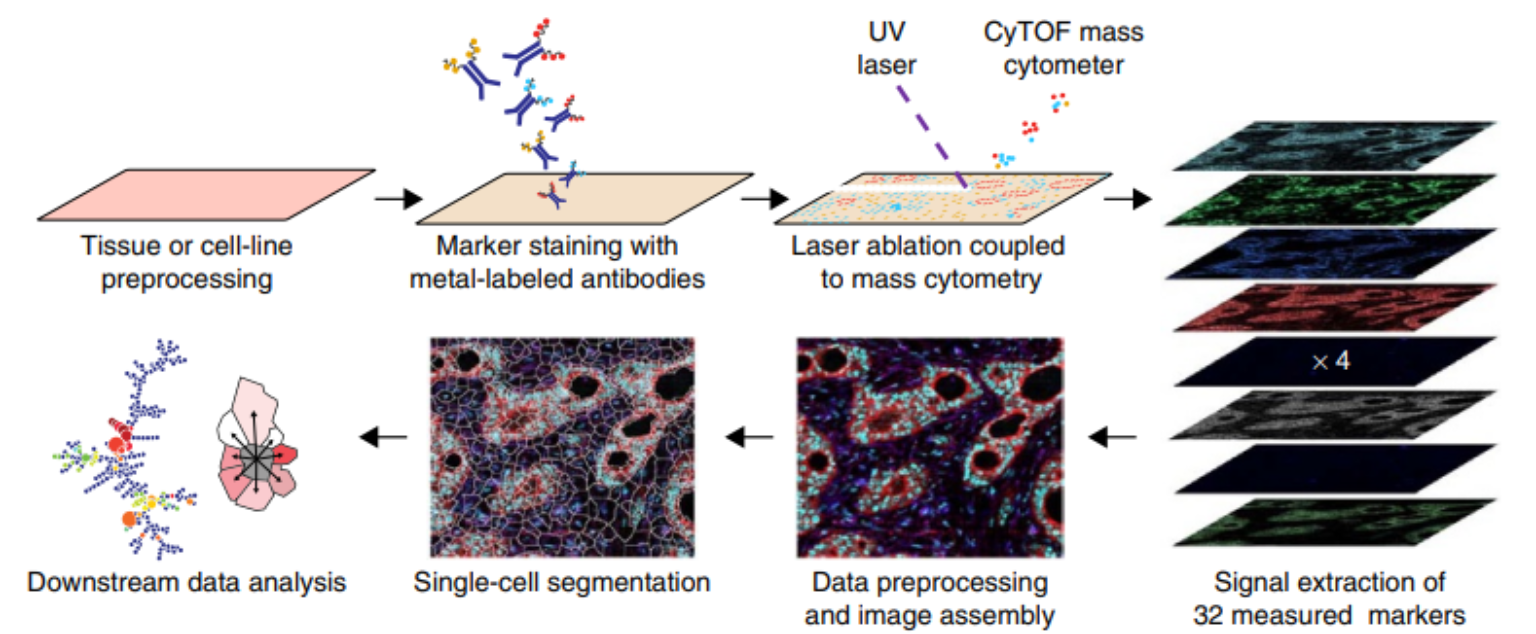 Overview of imaging mass cytometry data acquisition. Taken from Giesen et al.1
What it is
IMC was first described by the Bodenmiller laboratory in 20141. Since then it has been commercialised by Fluidigm® and is now distributed as the Hyperion™ imaging system (documentation is available here). IMC captures the spatial expression of multiple proteins and mRNA molecules in parallel. With a nominal 1 μm resolution, IMC is able to detect cytoplasmic and nuclear localisation of proteins. The current ablation frequency of IMC is 200Hz, meaning that a 1 mm2 area can be imaged within about 2 hours.
How it works
Technical aspects of data acquisition are described in the original publication1. Briefly, antibodies to detect targets in biological material are labeled with heavy metals (e.g., lanthanides) that do not occur in biological systems and thus can be used upon binding to their target as a readout similar to fluorophores in fluorescence microscopy. Thin sections of the biological sample on a glass slide are stained with an antibody cocktail. Stained microscopy slides are mounted on a precise motor-driven stage inside the ablation chamber of the IMC instrument. A high-energy UV laser is focused on the tissue, and each individual laser shot ablates tissue from an area of roughly 1 μm2. The energy of the laser is absorbed by the tissue resulting in vaporization followed by condensation of the ablated material. The ablated material from each laser shot is transported in the gas phase into the plasma of the mass cytometer, where first atomization of the particles and then ionization of the atoms occurs. The ion cloud is then transferred into a vacuum, and all ions below a mass of 80 m/z are filtered using a quadrupole mass filter. The remaining ions (mostly those used to tag antibodies) are analyzed in a time-of-flight mass spectrometer to ultimately obtain an accumulated mass spectrum from all ions that correspond to a single laser shot. One can regard this spectrum as the information underlying a 1 μm2 pixel. With repetitive laser shots (e.g., at 200 Hz) and a simultaneous lateral sample movement, a tissue can be ablated pixel by pixel. Ultimately an image is reconstructed from each pixel mass spectrum.
In principle, IMC can be applied to the same type of samples as conventional fluorescence microscopy. The largest distinction from fluorescence microscopy is that for IMC primary-labeled antibodies are commonly used, whereas in fluorescence microscopy secondary antibodies carrying fluorophores are widely applied. Additionally, for IMC, samples are dried before acquisition and can be stored for years. Formalin-fixed and paraffin-embedded (FFPE) samples are widely used for IMC. The FFPE blocks are cut to 2-5 μm thick sections and are stained, dried, and analyzed with IMC.
Antibodies and Staining
Metal-labeled antibodies are used to stain molecules in tissues enabling to delineate tissue structures, cells, and subcellular structures. Metal-conjugated antibodies can either be purchased directly from Fluidigm (MaxPar IMC Antibodies), or antibodies can be purchased and labeled individually (MaxPar Antibody Labeling). Antibody labeling using the MaxPar kits is performed via TCEP antibody reduction followed by crosslinking with sulfhydryl-reactive maleimide-bearing metal polymers. For each antibody it is essential to validate its functionality, specificity and optimize its usage to provide optimal signal to noise. To facilitate antibody handling, a database is highly useful. Airlab is such a platform; it allows antibody lot tracking, validation data uploads, and panel generation for subsequent upload to the IMC acquisition software from Fluidigm.
Depending on the sample type, different staining protocols can be used. Generally, once antibodies of choice have been conjugated to a metal tag, titration experiments are performed to identify the optimal staining concentration. For FFPE samples, different staining protocols have been described, and different antibodies show variable staining with different protocols. Protocols such as the one provided by Fluidigm or the one describe by Ijsselsteijn et al.2 are recommended. Briefly, for FFPE tissues, a dewaxing step is performed to remove the paraffin used to embed the material, followed by a graded re-hydration of the samples. Thereafter, heat-induced epitope retrieval (HIER), a step aiming at the reversal of formalin-based fixation, is used to unmask epitopes within tissues and make them accessible to antibodies. Epitope unmasking is generally performed in either basic, EDTA-based buffers (pH 9.2) or acidic, citrate-based buffers (pH 6). Next, a buffer containing bovine serum albumin (BSA) is used to block non-specific binding. This buffer is also used to dilute antibody stocks for the actual antibody staining. Staining time and temperature may vary and optimization must be performed to ensure that each single antibody performs well. However, overnight staining at 4°C or 3-5 hours at room temperature seem to be suitable in many cases.
Following antibody incubation, unbound antibodies are washed away and a counterstain comparable to DAPI is applied to enable the identification of nuclei. The Iridium intercalator from Fluidigm is a reagent of choice and applied in a brief 5 minute staining. Finally, the samples are washed again and then dried under an airflow. Once dried, the samples are ready for analysis on the imaging mass cytometer and are usually stable for a long period of time (at least one year).
Data acquisition
Data is acquired using the CyTOF software from Fluidigm (see manuals here).
The regions of interest are selected by providing coordinates for ablation. To determine the region to be imaged, so called "panoramas" can be generated. These are stitched images of single fields of views of about 200 μm in diameter. Panoramas provide an optical overview of the tissue with a resolution similar to 10x in microscopy and are intended to help with the selection of regions of interest for ablation. The tissue should be centered on the glass side, since the imaging mass cytometer cannot access roughly 5 mm from each of the slide edges. Currently, the instruments can process one slide at a time and one .mcd file per sample slide is generated.
Many regions of interest can be defined on a single slide and acquisition parameters such as channels to acquire, acquisition speed (100 Hz, or 200 Hz), ablation energy, and other parameters are user-defined. It is recommended that all isotope channels are recorded. Some channels provide information on potential contamination of the argon gas (e.g., Xenon) or of the samples (e.g., lead, barium). This results in a raw data file larger in size than if only channels corresponding to metals used are acquired.
To process a large number of slides or to select regions on whole-slide samples, panoramas may not provide sufficient information. If this is the case, multi-color immunofluorescence of the same slide prior to staining with metal-labeled antibodies may be performed. To allow for region selection based on immunofluorescence images and to align those images with a panorama of the same or consecutive sections of the sample, we developed napping.
Acquisition time is directly proportional to the total size of ablation, and run times for samples of large area or for large sample numbers can be calculated by dividing the ablation area in square micrometer by the ablation speed (e.g., 200Hz). In addition to the proprietary .mcd file format, .txt files can also be generated for each region of interest. This is recommended as a back-up option in case of errors that may corrupt .mcd files but not .txt files.
How the data looks
Upon completion of the acquisition, an .mcd file of variable size is generated. This file contains all panoramas, all acquisition images, and image metadata. Additionally, for each acquisition a .txt file is generated that holds the same pixel information as the matched acquisitions in the .mcd file. We refer to this data as raw data. Further processing of these data is described in Image processing.
To get a quick view of the data, multiple image viewers are available, and an overview is provided in Image visualization
-
Giesen C. et al. (2014) Highly multiplexed imaging of tumor tissues with subcellular resolution by mass cytometry. Nat. Methods, 11, 417-422. ↩↩↩
-
Ijsselsteijn M.E. et al. (2019) A 40-Marker Panel for High Dimensional Characterization of Cancer Immune Microenvironments by Imaging Mass Cytometry. Frontiers in Immunology, 10, 2534. ↩