Helper function for estimating the spillover matrix. Per metal spot, consecutive pixels a aggregated (default: summed).
binAcrossPixels(
  object,
  bin_size,
  spot_id = "sample_id",
  assay_type = "counts",
  statistic = "sum",
  ...
)
Arguments
- object
a
SingleCellExperimentobject containing pixel intensities for all channels. Individual pixels are stored as columns and channels are stored as rows.- bin_size
single numeric indicating how many consecutive pixels per spot should be aggregated.
- spot_id
character string indicating which
colData(object)entry stores the isotope names of the spotted metal.- assay_type
character string indicating which assay to use.
- statistic
character string indicating the statistic to use for aggregating consecutive pixels.
- ...
additional arguments passed to
aggregateAcrossCells
Value
returns the binned pixel intensities in form of a
SingleCellExperiment object
See also
aggregateAcrossCells for the aggregation
function
Examples
path <- system.file("extdata/spillover", package = "imcRtools")
# Read in .txt files
sce <- readSCEfromTXT(path)
#> Spotted channels:  Dy161, Dy162, Dy163, Dy164
#> Acquired channels:  Dy161, Dy162, Dy163, Dy164
#> Channels spotted but not acquired:
#> Channels acquired but not spotted:
dim(sce)
#> [1]   4 400

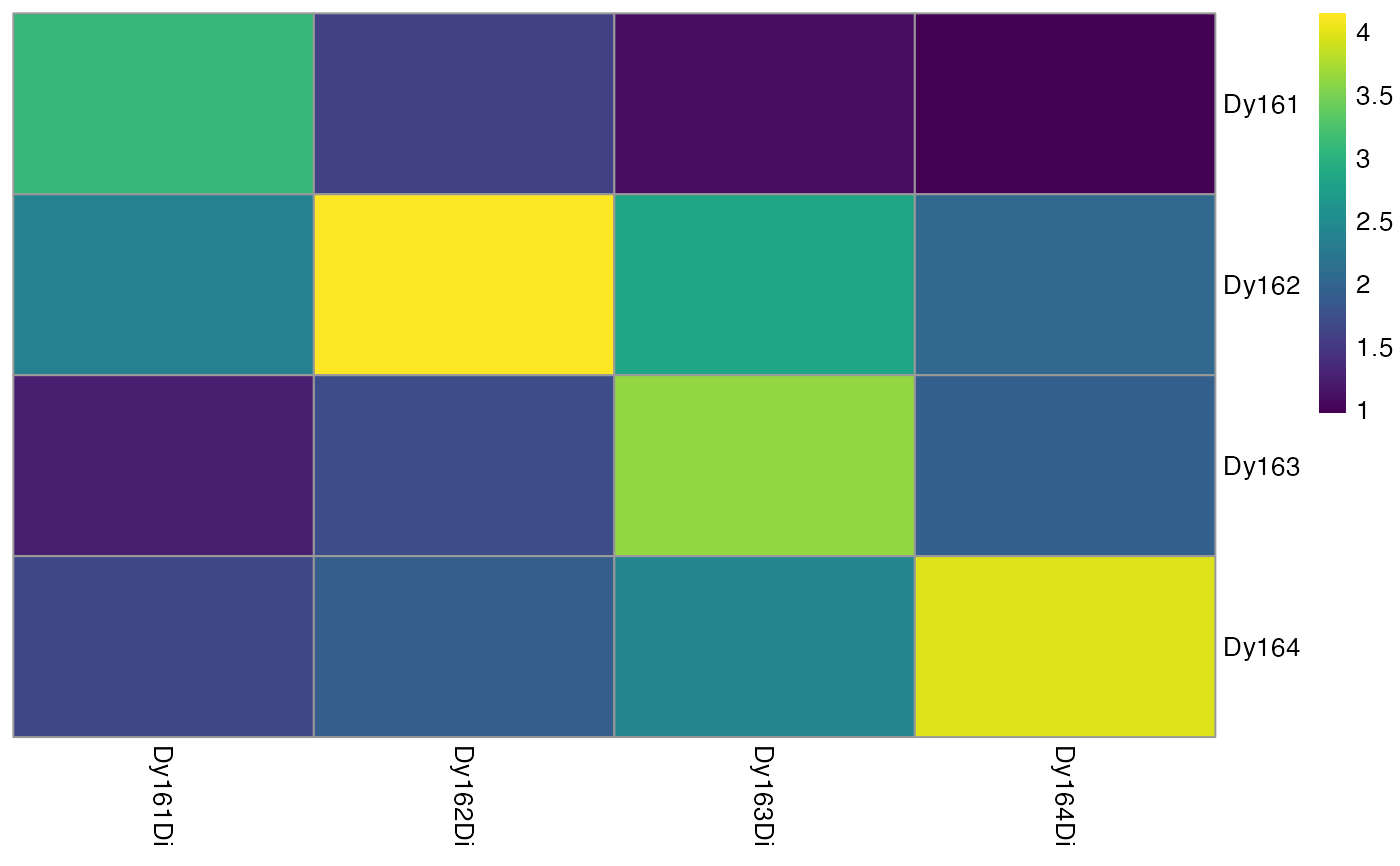
# Visualizes heatmap before aggregation
plotSpotHeatmap(sce)


# Sum consecutive pixels
sce <- binAcrossPixels(sce, bin_size = 10)
dim(sce)
#> [1]  4 40

# Visualizes heatmap after aggregation
plotSpotHeatmap(sce)
