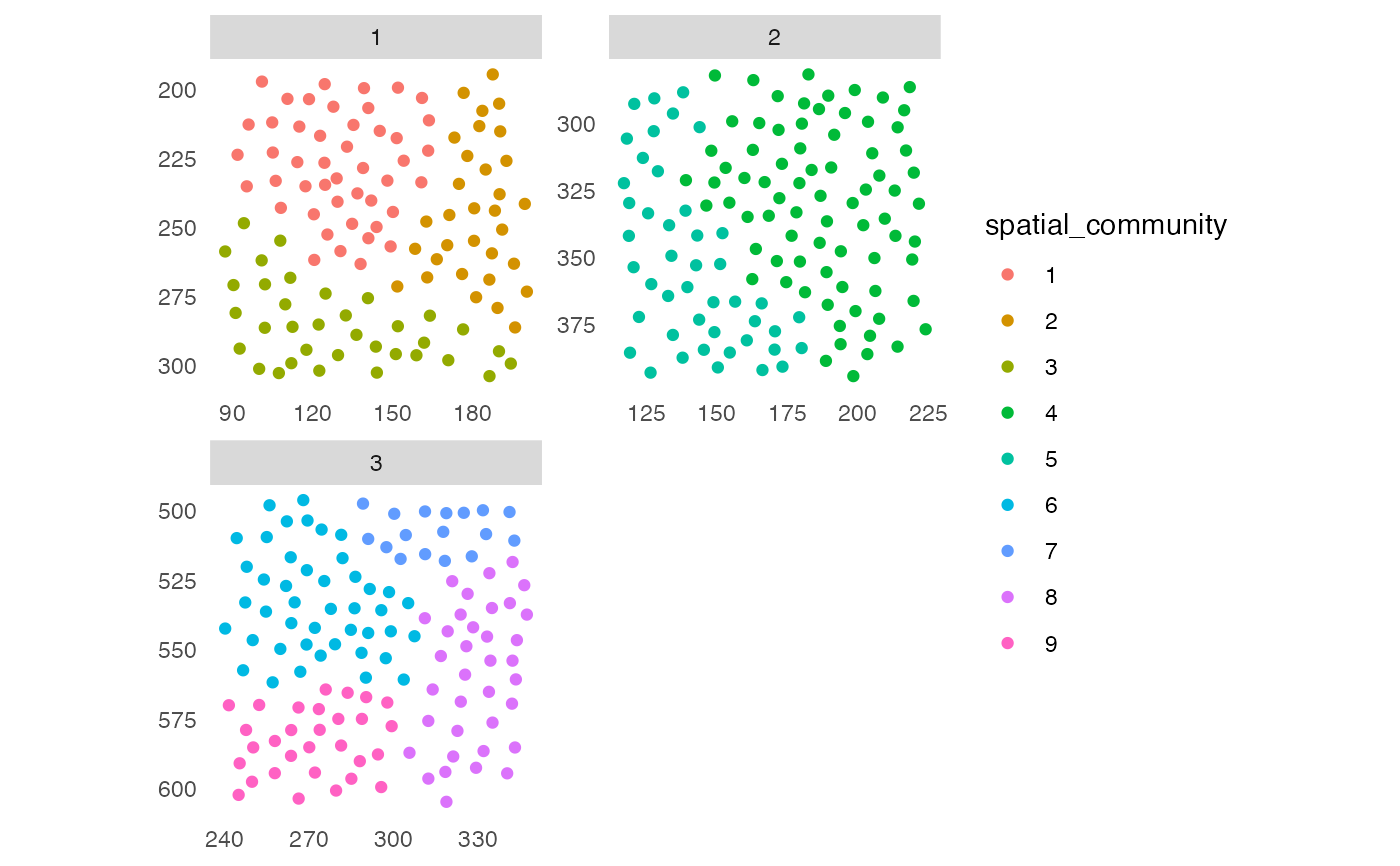
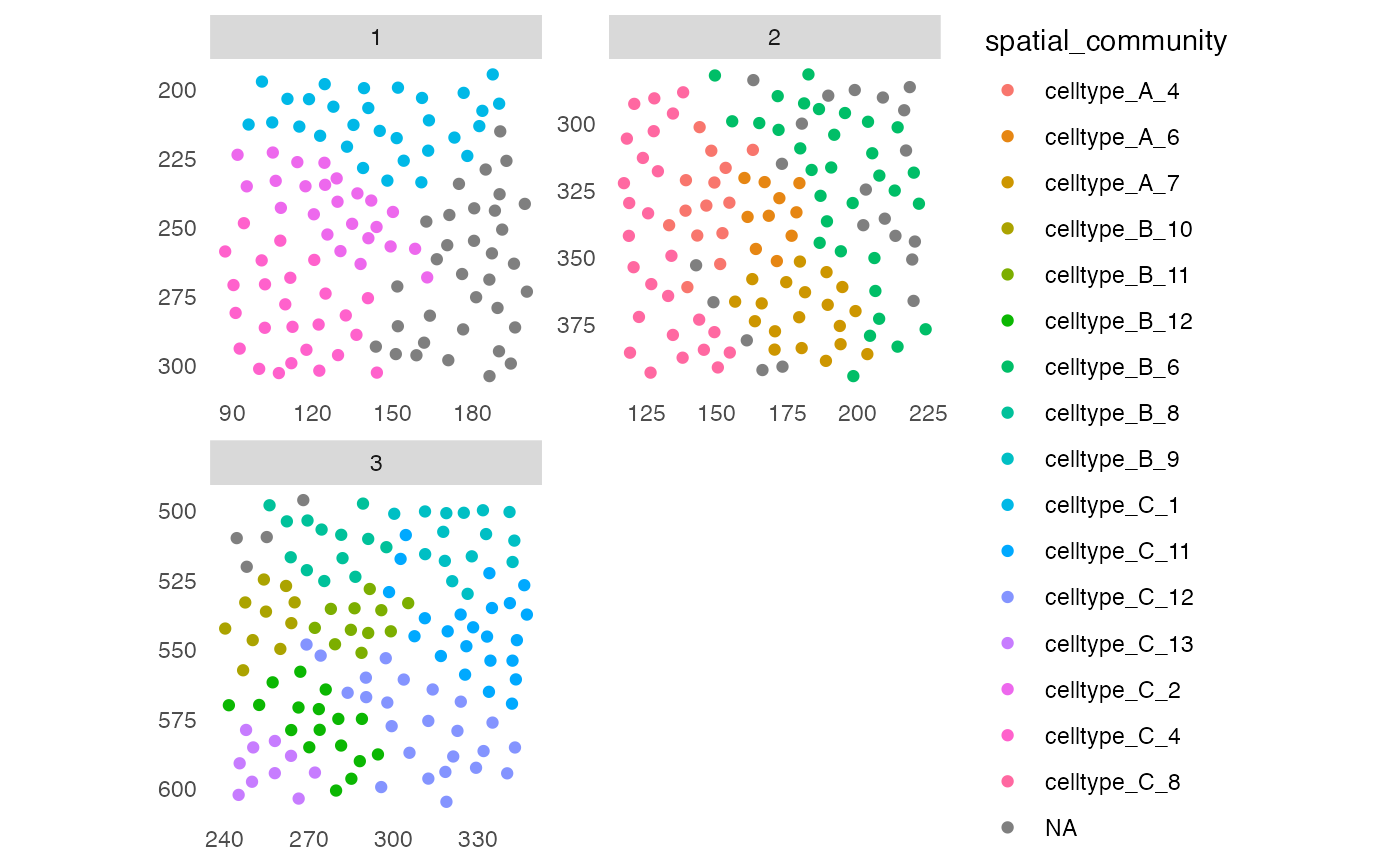
Function to detect the spatial community of each cell as proposed by Jackson et al., The single-cell pathology landscape of breast cancer, Nature, 2020. Each cell is clustered based on its interactions as defined by a spatial object graph.
detectCommunity(
  object,
  colPairName,
  size_threshold = 0,
  group_by = NULL,
  name = "spatial_community",
  cluster_fun = "louvain",
  BPPARAM = SerialParam()
)
Arguments
- object
a
SingleCellExperimentorSpatialExperimentobject- colPairName
single character indicating the
colPair(object)entry containing the neighbor information.- size_threshold
single positive numeric that specifies the minimum number of cells per community. Defaults to 0.
- group_by
single character indicating that spatial community detection will be performed separately for all unique entries to
colData(object)[,group_by].- name
single character specifying the name of the output saved in
colData(object). Defaults to "spatial_community".- cluster_fun
single character specifying the function to use for community detection. Options are all strings that contain the suffix of an
igraphcommunity detection algorithm (e.g. "walktrap"). Defaults to "louvain".- BPPARAM
a
BiocParallelParam-classobject defining how to parallelize computations. Applicable whengroup_byis specified and defaults toSerialParam(). For reproducibility between runs, we recommend definingRNGseedin theBiocParallelParam-classobject.
Value
returns an object of class(object) containing a new column
entry to colData(object)[[name]].
Spatial community detection procedure
1. Create an igraph object from the edge list stored in
colPair(object, colPairName).
2. Perform community detection using the specified cluster_fun algorithm.
3. Store the community IDs in a vector and replace all communities with
a size smaller than size_threshold by NA.
Optional steps: Specify group_by to perform spatial community
detection separately for all unique entries to colData(object)[,group_by]
e.g. for tumor and non-tumor cells.
Examples
library(cytomapper)
library(BiocParallel)
data(pancreasSCE)

sce <- buildSpatialGraph(pancreasSCE, img_id = "ImageNb",
                        type = "expansion",
                        name = "neighborhood",
                        threshold = 20)
#> The returned object is ordered by the 'ImageNb' entry.

## Detect spatial community
set.seed(22)
sce <- detectCommunity(sce,
                      colPairName = "neighborhood",
                      size_threshold = 10)

plotSpatial(sce,
            img_id = "ImageNb",
            node_color_by = "spatial_community",
            scales = "free")


## Detect spatial community - specify group_by
sce <- detectCommunity(sce,
                       colPairName = "neighborhood",
                       group_by = "CellType",
                       size_threshold = 10,
                       BPPARAM = SerialParam(RNGseed = 22))

plotSpatial(sce,
            img_id = "ImageNb",
            node_color_by = "spatial_community",
            scales = "free")
