Function to detect patches containing defined cell types
Source:R/patchDetection.R
patchDetection.RdFunction to detect spatial clusters of defined types of cells. By defining a certain distance threshold, all cells within the vicinity of these clusters are detected as well.
patchDetection(
  object,
  patch_cells,
  colPairName,
  min_patch_size = 1,
  name = "patch_id",
  expand_by = 0,
  coords = c("Pos_X", "Pos_Y"),
  convex = FALSE,
  img_id = NULL,
  BPPARAM = SerialParam()
)
Arguments
- object
a
SingleCellExperimentorSpatialExperimentobject- patch_cells
logical vector of length equal to the number of cells contained in
object.TRUEentries define the cells to consider for patch detection (see Details).- colPairName
single character indicating the
colPair(object)entry containing the neighbor information.- min_patch_size
single integer indicating the minimum number of connected cells that make up a patch before expansion.
- name
single character specifying the
colDataentry storing the patch IDs in the returned object.- expand_by
single numeric indicating in which vicinity range cells should be considered as belonging to the patch (see Details).
- coords
character vector of length 2 specifying the names of the
colData(for aSingleCellExperimentobject) or thespatialCoordsentries of the cells' x and y locations.- convex
should the convex hull be computed before expansion? Default: the concave hull is computed.
- img_id
single character indicating the
colData(object)entry containing the unique image identifiers.- BPPARAM
a
BiocParallelParam-classobject defining how to parallelize computations.
Value
An object of class(object) containing a patch ID for each
cell in colData(object)[[name]]. If expand_by > 0, cells in the
output object are grouped by entries in img_id.
Detecting patches of defined cell types
This function works as follows:
1. Only cells defined by patch_cells are considered for patch
detection.
2. Patches of connected cells are detected. Here, cell-to-cell connections
are defined by the interaction graph stored in
colPair(object, colPairName). At this point, patches that contain
fewer than min_patch_size cells are removed.
3. If expand_by > 0, a concave (default) or convex hull is constructed
around each patch. This is is then expanded by expand_by and cells
within the expanded hull are detected and assigned to the patch. This
expansion only works if a patch contains at least 3 cells.
The returned object contains an additional entry
colData(object)[[name]], which stores the patch ID per cell. NA
indicate cells that are not part of a patch.
Ordering of the output object
If expand_by > 0, the patchDetection function operates on individual images.
Therefore the returned object is grouped by entries in img_id.
This means all cells of a given image are grouped together in the object.
The ordering of cells within each individual image is the same as the ordering
of these cells in the input object.
If expand_by = 0, the ordering of cells in the output object is the same as
in the input object.
Examples
library(cytomapper)
data(pancreasSCE)
# Visualize cell types
plotSpatial(pancreasSCE,
img_id = "ImageNb",
node_color_by = "CellType",
scales = "free")
 # Build interaction graph
pancreasSCE <- buildSpatialGraph(pancreasSCE, img_id = "ImageNb",
type = "expansion", threshold = 20)
#> The returned object is ordered by the 'ImageNb' entry.
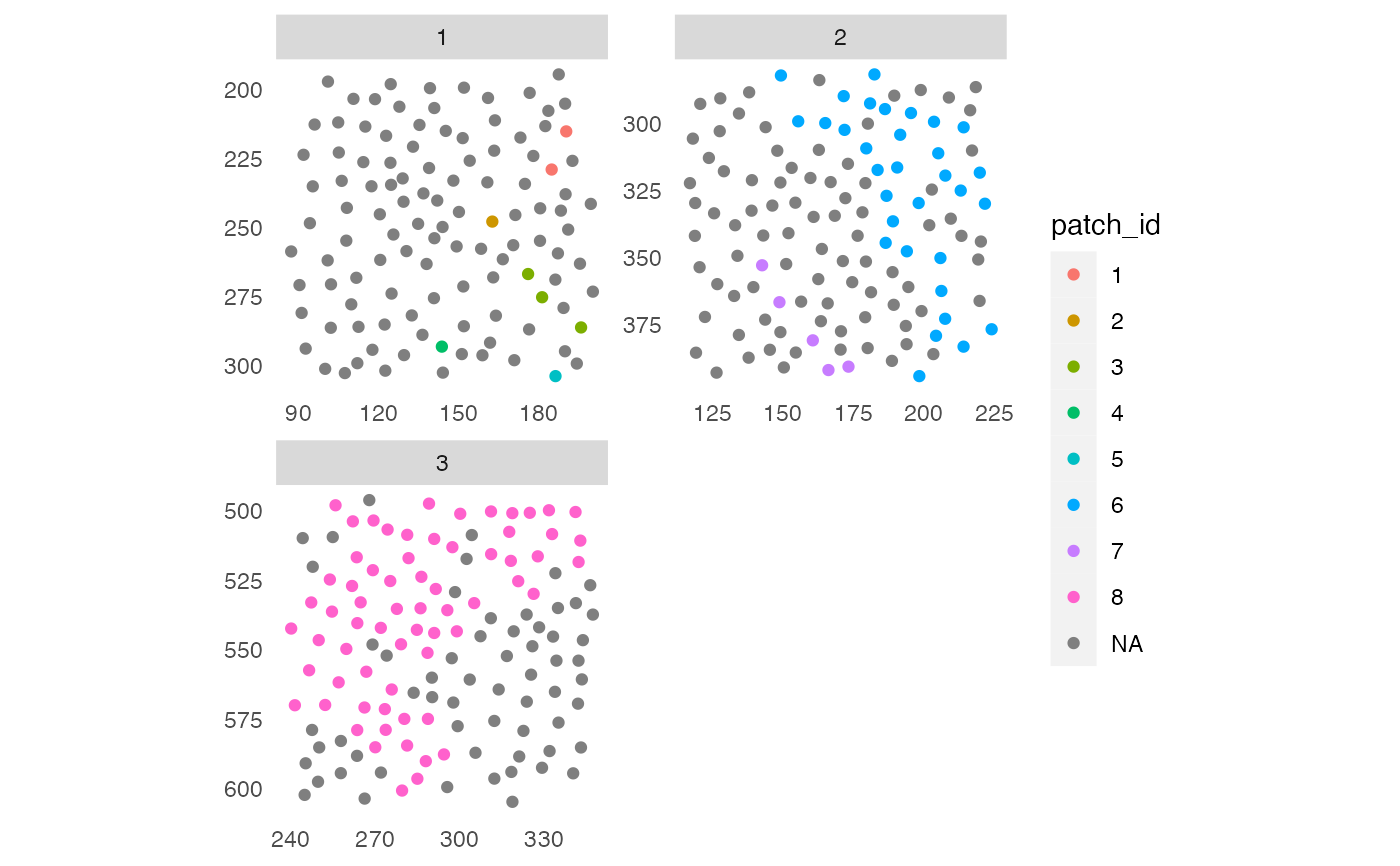
# Detect patches of "celltype_B" cells
pancreasSCE <- patchDetection(pancreasSCE,
patch_cells = pancreasSCE$CellType == "celltype_B",
colPairName = "expansion_interaction_graph")
plotSpatial(pancreasSCE,
img_id = "ImageNb",
node_color_by = "patch_id",
scales = "free")
# Build interaction graph
pancreasSCE <- buildSpatialGraph(pancreasSCE, img_id = "ImageNb",
type = "expansion", threshold = 20)
#> The returned object is ordered by the 'ImageNb' entry.
# Detect patches of "celltype_B" cells
pancreasSCE <- patchDetection(pancreasSCE,
patch_cells = pancreasSCE$CellType == "celltype_B",
colPairName = "expansion_interaction_graph")
plotSpatial(pancreasSCE,
img_id = "ImageNb",
node_color_by = "patch_id",
scales = "free")
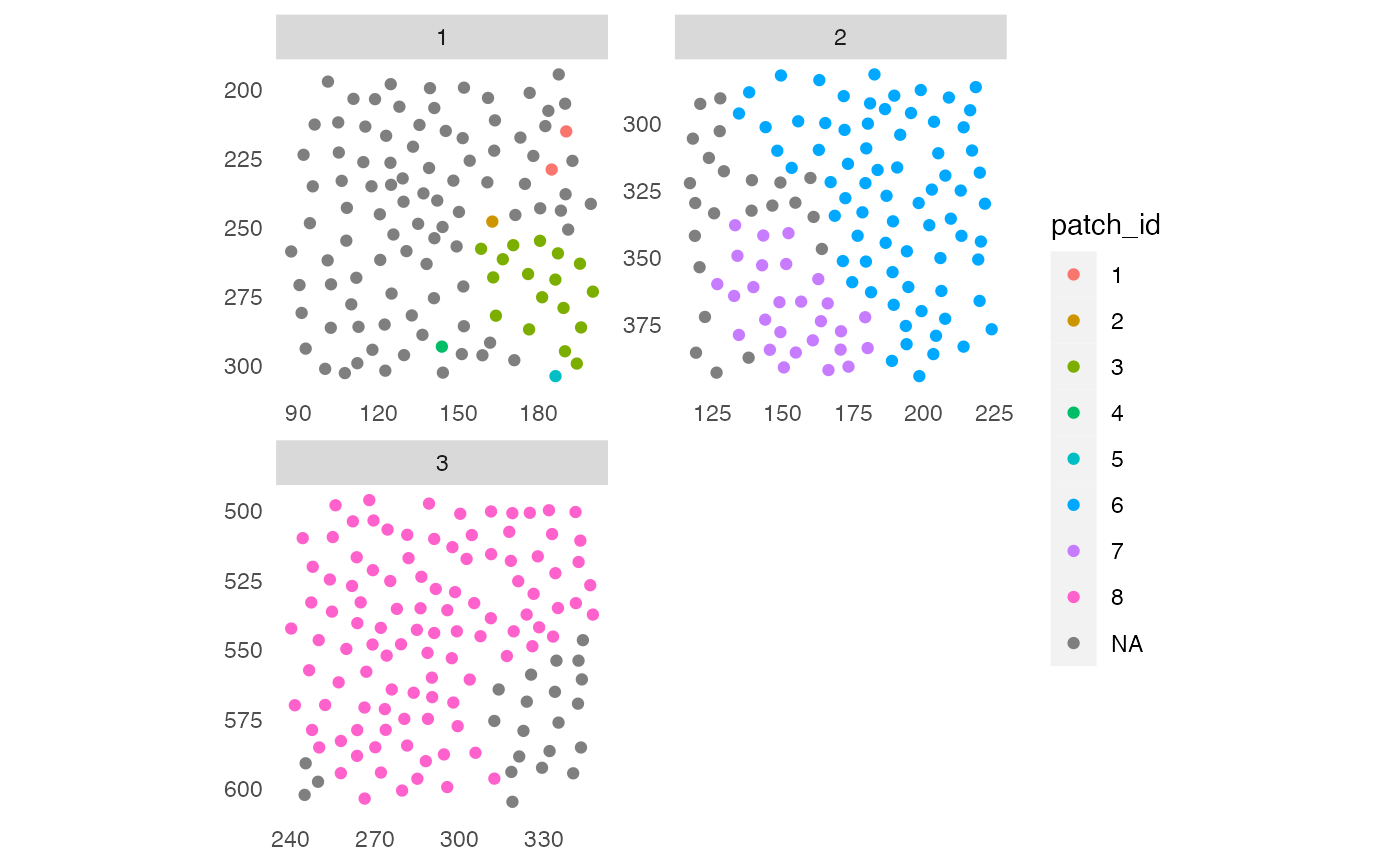
 # Include cells in vicinity
pancreasSCE <- patchDetection(pancreasSCE,
patch_cells = pancreasSCE$CellType == "celltype_B",
colPairName = "expansion_interaction_graph",
expand_by = 20,
img_id = "ImageNb")
#> The returned object is ordered by the 'ImageNb' entry.
plotSpatial(pancreasSCE,
img_id = "ImageNb",
node_color_by = "patch_id",
scales = "free")
# Include cells in vicinity
pancreasSCE <- patchDetection(pancreasSCE,
patch_cells = pancreasSCE$CellType == "celltype_B",
colPairName = "expansion_interaction_graph",
expand_by = 20,
img_id = "ImageNb")
#> The returned object is ordered by the 'ImageNb' entry.
plotSpatial(pancreasSCE,
img_id = "ImageNb",
node_color_by = "patch_id",
scales = "free")