Measurement of object features
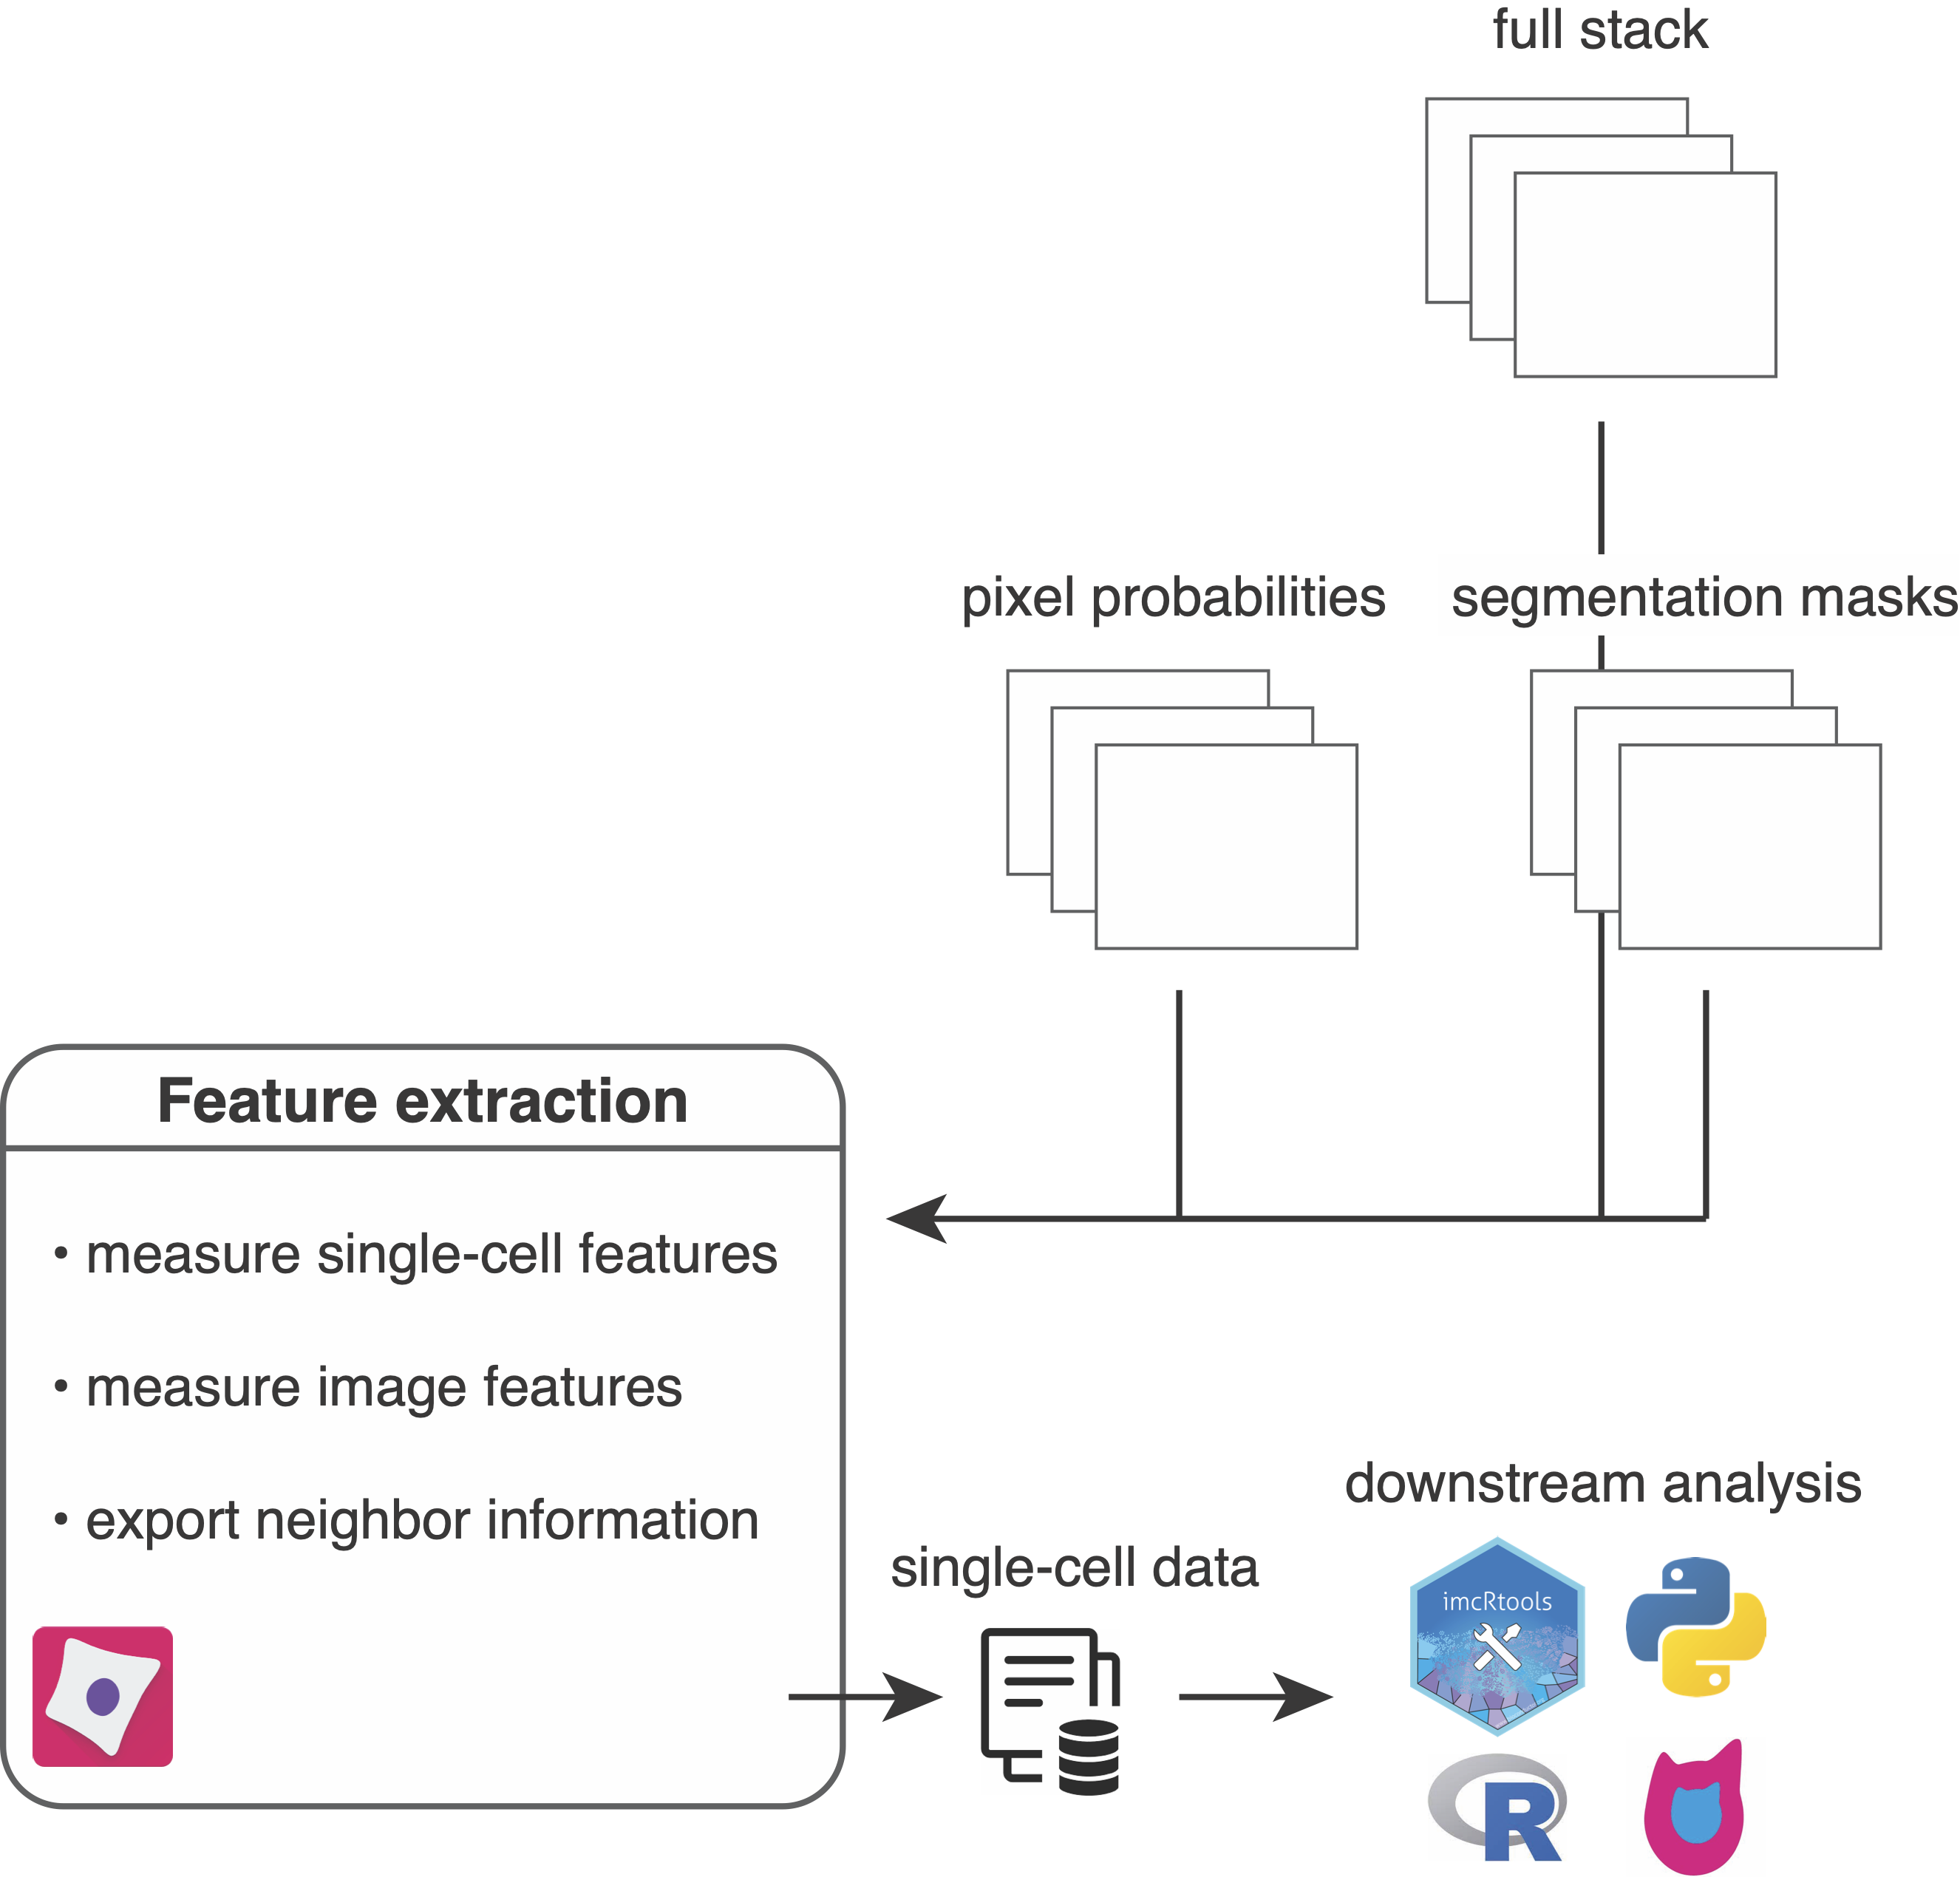
After image segmentation to identify individual objects/cells, the next CellProfiler pipeline will measure single-object and single-image features.
Set up the pipeline by importing the resources/pipelines/3_measure_mask.cppipe pipeline into CellProfiler and perform following steps:
- Drag and drop the
analysis/cpoutfolder into theImageswindow. - In the
Output Settingsadjust theDefault Output Foldertoanalysis/cpout. - In the
Output Settingsadjust theDefault Input Foldertoanalysis/cpinp.
The following steps are part of the pipeline:
Metadata: Metadata from the images (acnameandacid) are matched and merged with image metadata generated during pre-processing (contained in theanalysis/cpinp/acquisition_metadata.csvfile).NamesAndTypes: The multi-channel images (stored inanalysis/cpout/images), segmentation masks (stored inanalysis/cpout/images) and the pixel probabilities (stored inanalysis/cpout/probabilities) are read in and matched via their acquisition name (acname) and acquisition ID (acid).- Segmentation masks are read in as 16-bit grayscale images and are converted to objects while keeping their original labels in place.
- For each cell its neighbors are detected by expanding the mask by a defined distance.
- The full stack channel intensities per object/cell are extracted. Make sure to adjust the channel number to your dataset. You can observe the total channel number in the
analysis/cpout/images/..._full.csvfiles. - The probability stack channel intensities per object/cell are extracted.
- The size and shape features per object/cell are extracted.
- The full stack channel intensities per image are extracted. Make sure to adjust the channel number to your dataset. You can observe the total channel number in the
analysis/cpout/images/..._full.csvfiles. - The probability stack channel intensities per image are extracted.
- The object/cell, image and experiment data is saved as
.csvfiles. Thecell.csvfile contains single-cell features including intensity and morphological features. Here are a few notes to the export:- You can select a subset of features by setting
Select the measurements to exporttoYes. We usually work with theMeanIntensitycell measurements. - the intensity values are all scaled by a scaling factor corresponding to the bit depth. This scaling factor can be found in the
Image.csvfile in theScaling_FullStackcolumn. For 16-bit unsigned integer images (uint16) as we use them here the values are divided by2**16 - 1 = 65535. - The channel identifier
_c1,_c2,_c3, ... corresponds to the position in the..._full.csvfiles found in theanalysis/cpout/imagesfolder. - The original acquisition description, acquisition frequencies, acquisition name, etc. can be found in the
Image.csvoutput file asMetdata_...columns.
- You can select a subset of features by setting
- The cell-cell neighbor information detected in step 4 are exported as
.csvfile containing an edge list. - The final output are
.csvfiles that contain additional metadata per measured feature. For the cell features the following information is written out:category(e.g. Intensity),image_name(e.g. FullStack),object_name,feature_name(e.g. MeanIntensity),channel(e.g. 1),parameters,channel_id(e.g. Ir191) anddata_type(e.g. float)
Output
After feature measurment the following files have been generated:
analysis/cpout/cell.csv: contains features (columns) for each cell (rows).analysis/cpout/Experiment.csv: contains metadata related to the CellProfiler version used.analysis/cpout/Image.csv: contains image-level measurements (e.g. channel intensities) and acquisition metadata.analysis/cpout/Object relationships.csv: contains neighbor information in form of an edge list between cells.analysis/cpout/var_cell.csv: contains feature metadata for all single-cell features.analysis/cpout/var_Image.csv: contains feature metadata for all image features.