Function to calculate minimal distance to cells of interest
Source:R/minDistToCells.R
minDistToCells.RdFunction to return the distance of the closest cell of interest for each cell in the data. In the case of patched/clustered cells negative distances are returned by default which indicate the distance of the cells of interest to the closest cell that is not of the type of cells of interest.
minDistToCells(
  object,
  x_cells,
  img_id,
  name = "distToCells",
  coords = c("Pos_X", "Pos_Y"),
  return_neg = TRUE,
  BPPARAM = SerialParam()
)
Arguments
- object
a
SingleCellExperimentorSpatialExperimentobject- x_cells
logical vector of length equal to the number of cells contained in
object.TRUEentries define the cells to which distances will be calculated.- img_id
single character indicating the
colData(object)entry containing the unique image identifiers.- name
character specifying the name of the
colDataentry to safe the distances in.- coords
character vector of length 2 specifying the names of the
colData(for aSingleCellExperimentobject) or thespatialCoordsentries of the cells' x and y locations.- return_neg
logical indicating whether negative distances are to be returned for the distances of patched/spatially clustered cells.
- BPPARAM
a
BiocParallelParam-classobject defining how to parallelize computations.
Value
returns an object of class(object) containing a new column
entry to colData(object)[[name]]. Cells in the object are grouped
by entries in img_id.
Ordering of the output object
The minDistToCells function operates on individual images.
Therefore the returned object is grouped by entries in img_id.
This means all cells of a given image are grouped together in the object.
The ordering of cells within each individual image is the same as the ordering
of these cells in the input object.
Examples
library(cytomapper)
data(pancreasSCE)
# Build interaction graph
pancreasSCE <- buildSpatialGraph(pancreasSCE, img_id = "ImageNb",
type = "expansion",threshold = 20)
#> The returned object is ordered by the 'ImageNb' entry.
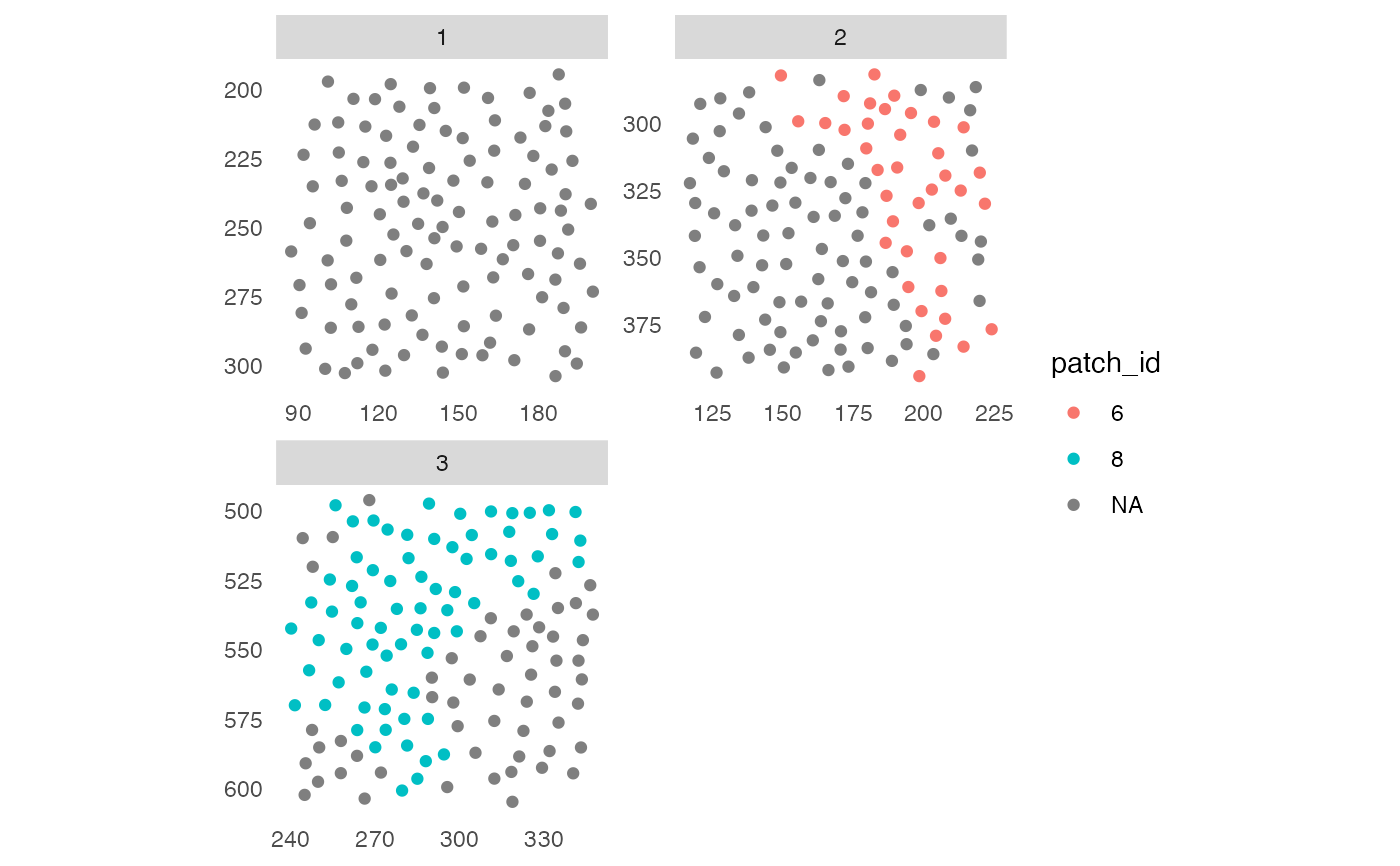
# Detect patches of "celltype_B" cells
pancreasSCE <- patchDetection(pancreasSCE,
img_id = "ImageNb",
patch_cells = pancreasSCE$CellType == "celltype_B",
colPairName = "expansion_interaction_graph",
min_patch_size = 20,
expand_by = 1)
#> The returned object is ordered by the 'ImageNb' entry.
plotSpatial(pancreasSCE,
img_id = "ImageNb",
node_color_by = "patch_id",
scales = "free")
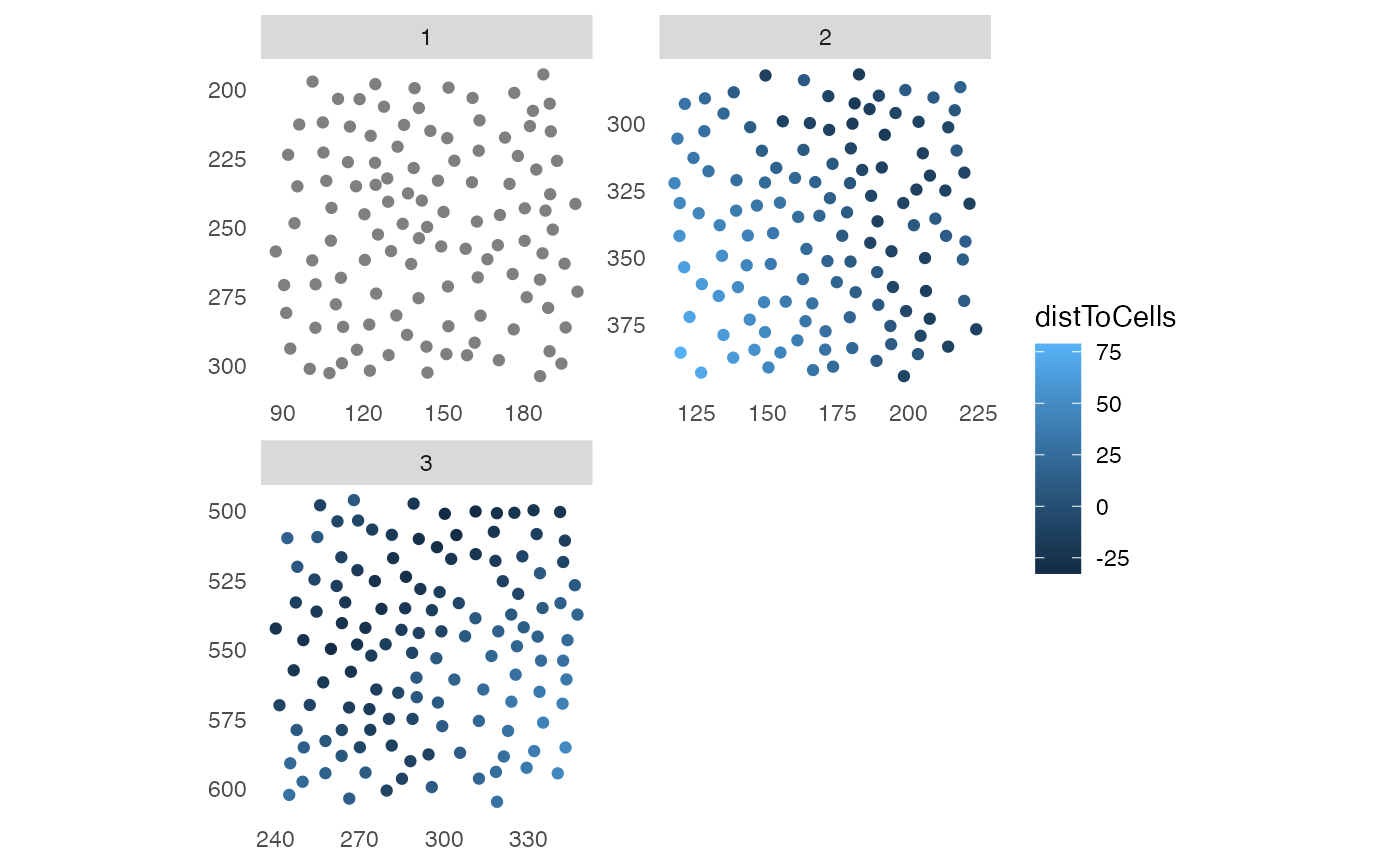
 # Distance to celltype_B patches
pancreasSCE <- minDistToCells(pancreasSCE,
x_cells = !is.na(pancreasSCE$patch_id),
coords = c("Pos_X","Pos_Y"),
img_id = "ImageNb")
#> The returned object is ordered by the 'ImageNb' entry.
plotSpatial(pancreasSCE,
img_id = "ImageNb",
node_color_by = "distToCells",
scales = "free")
# Distance to celltype_B patches
pancreasSCE <- minDistToCells(pancreasSCE,
x_cells = !is.na(pancreasSCE$patch_id),
coords = c("Pos_X","Pos_Y"),
img_id = "ImageNb")
#> The returned object is ordered by the 'ImageNb' entry.
plotSpatial(pancreasSCE,
img_id = "ImageNb",
node_color_by = "distToCells",
scales = "free")